Free trial on the Microsoft Store
Know Your Network.
Instantly.
HostMonitor watches your hosts and services around the clock — ICMP pings, TCP port checks, UDP probes, HTTP/HTTPS — and alerts you the moment something goes wrong.
HostMonitor watches your hosts and services around the clock — ICMP pings, TCP port checks, UDP probes, HTTP/HTTPS — and alerts you the moment something goes wrong.
Built for sysadmins, developers, and home lab enthusiasts who need reliable, lightweight host monitoring on Windows.
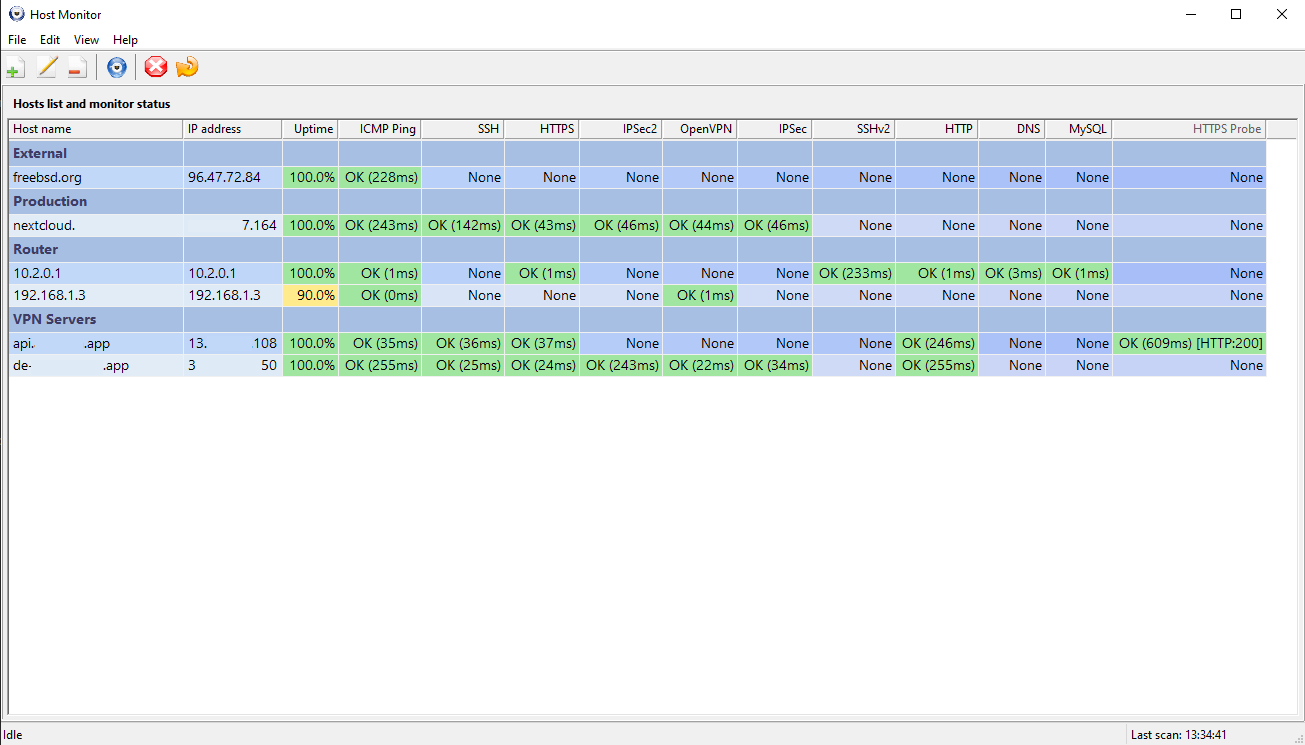
Monitor all your hosts in one glanceable table. Color-coded cells show available, timeout, and refused states at a glance.
Per-host statistics window with min/avg/max latency sparklines. Historical data persisted in a local SQLite database.
ICMP, TCP, UDP, HTTP, and HTTPS. Protocol-aware UDP payloads for DNS, NTP, SNMP, OpenVPN, and IKEv2/IPSec.
Three alarm modes: fire on every outage, once per outage, or only after N consecutive failures to cut through noise.
Organize hosts into logical groups — Production, Staging, Dev, or any category that fits your infrastructure.
Minimize to tray and keep monitoring silently. Native Windows notifications pop up the moment a host goes down.
Blue, Green, Lavender, and System themes. System mode tracks your Windows accent color automatically.
English, German, Spanish, French, Italian, Polish, and Ukrainian — all bundled, no extra downloads required.
All history stays on your machine. No cloud, no sign-up, no subscriptions. Your data is entirely yours.
A look at the actual application — the monitoring grid, per-host statistics, and the target setup dialog.
Main window — hosts organized into groups with per-protocol status columns and uptime percentages.
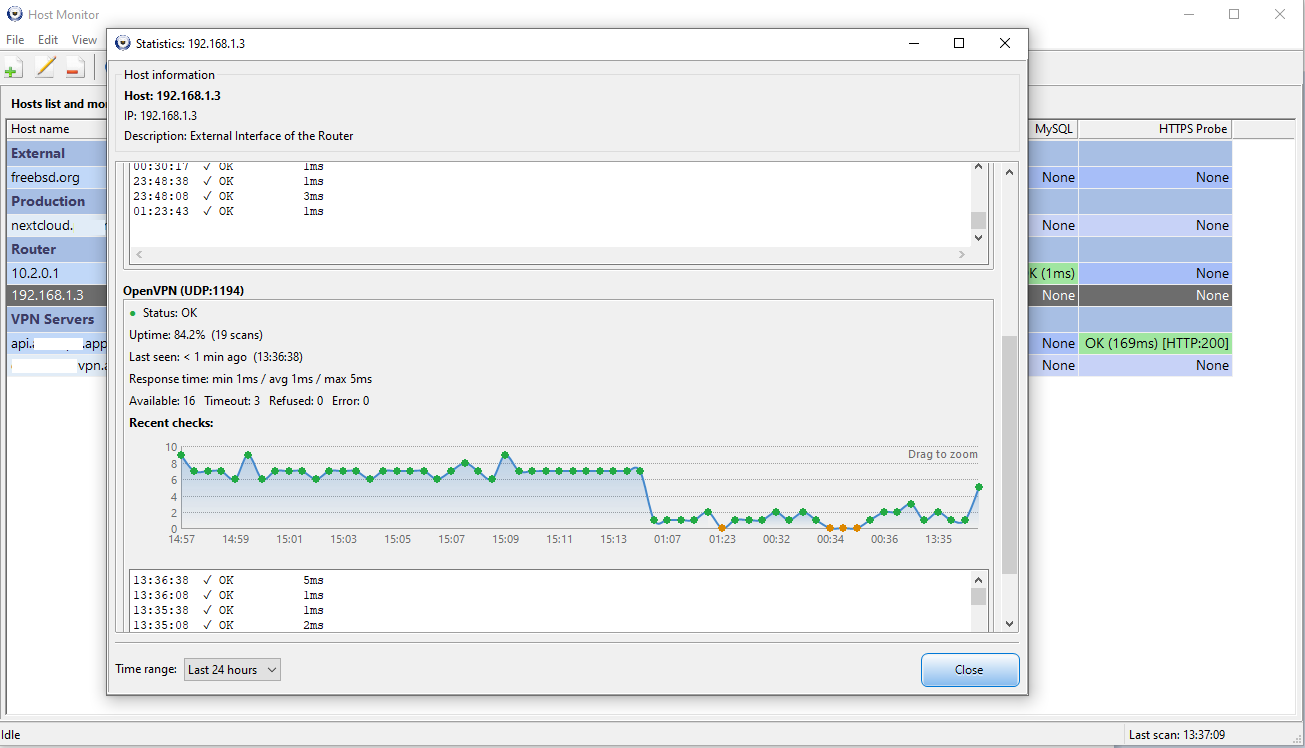
Statistics window — per-host latency chart with min/avg/max breakdown and full probe history.
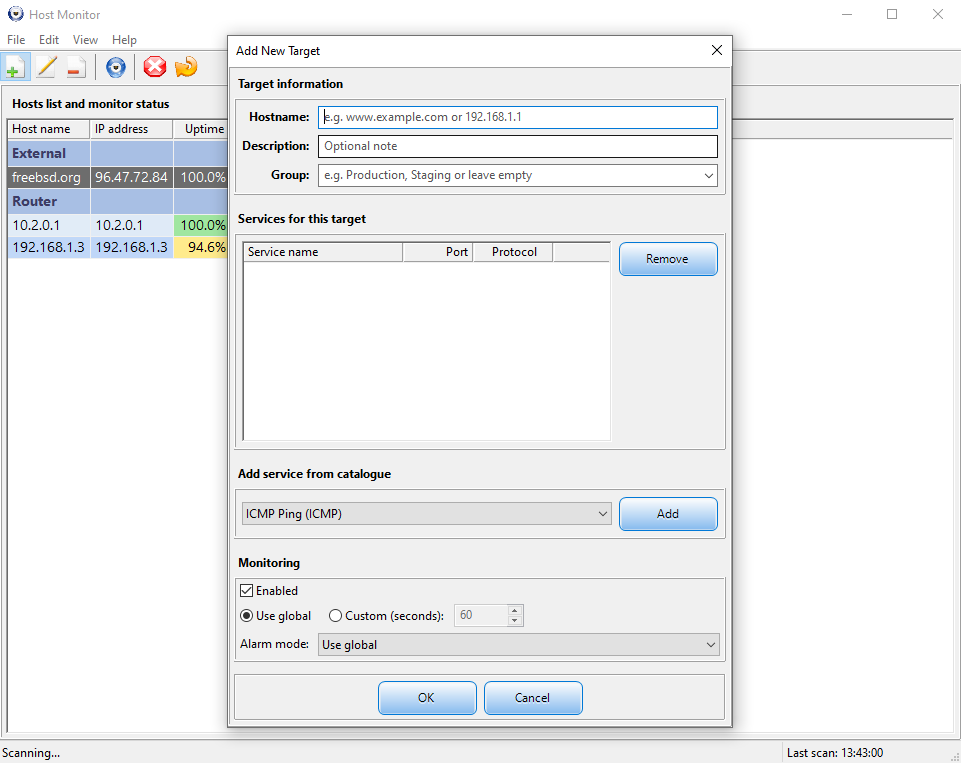
Add New Target — enter a hostname, assign a group, pick services from the catalogue, and configure per-host alarm and scan settings.
From a simple ICMP ping to a full HTTP response-body check — HostMonitor covers the range of probes you actually need.
Classic latency probe. Confirms basic IP reachability without requiring open ports.
Non-blocking connect to any port with configurable timeout. Covers SSH, RDP, databases, SMTP, and more.
Sends well-formed payloads for DNS, NTP, SNMP, OpenVPN, and IKEv2/IPSec — not a blind port knock.
Verifies expected status codes and optionally matches a pattern in the response body. Catches broken apps that still have open TCP ports.
| Port | Protocol | Payload |
|---|---|---|
| 53 | DNS | A-query for root zone |
| 123 | NTP | NTPv3 client request |
| 161, 162 | SNMP | SNMPv1 GetRequest |
| 500 | IKEv2 / IPSec | IKE_SA_INIT (AES-CBC-128) |
| 1194 | OpenVPN | P_CONTROL_HARD_RESET_V2 |
| 4500 | IKEv2 NAT-T | Non-ESP marker + IKE_SA_INIT |
| any | Generic | Single zero byte |
Pick the alarm mode that matches how noisy or quiet you want your monitoring to be.
Fires an alert for each failed probe. Maximum visibility — best for critical, low-traffic services.
Sounds once when a host goes down, then stays silent until it recovers. No repeated alarms for the same incident.
Wait for N back-to-back failures before alerting. Perfect for flaky hosts that occasionally drop a probe.
Switch themes instantly from Preferences. The System theme tracks your Windows accent color automatically.
Switch languages from Preferences — all translations ship with the app, no downloads required.
Try free from the Microsoft Store. Unlock the full version with a one-time $14.99 license — no subscription, no account required.
Download Free TrialReady to buy? Get a license for $14.99 →
Windows 10 / 11 · v1.0.0